File:Msitestplot.png
From SpiralKnights
No higher resolution available.
Msitestplot.png (450 × 289 pixels, file size: 9 KB, MIME type: image/png)
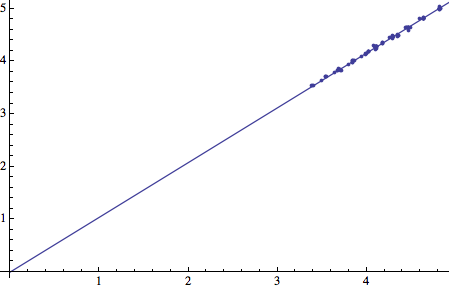
Plot of running speed, in tiles per second, when charging a sword at MSI+N vs. MSI+(N+1). The superimposed best-fit line has slope 1.04011. Thus each level of MSI increases speed by about 4%.
| |
|
File history
Click on a date/time to view the file as it appeared at that time.
| Date/Time | Thumbnail | Dimensions | User | Comment | |
|---|---|---|---|---|---|
| current | 21:35, 12 May 2014 | | 450 × 289 (9 KB) | Vroom (Talk | contribs) | Plot of running speed, in tiles per second, when charging a sword at MSI+N vs. MSI+(N+1). The superimposed best-fit line has slope 1.04011. Thus each level of MSI increases speed by about 4%. |
- You cannot overwrite this file.
File usage
The following page links to this file: