Lancer Knightz (Guild)/Mission Rarities
From SpiralKnights
This page is part of the Lancer Knightz data collection project. Its goal is to quantify the rarities and treasure boxes from all of the fighting missions. For data about crowns and spark tokens, go to our Mission Crowns page. To understand our data collection procedure or learn how you can contribute, go to our Missions main page.
Contents
Rarities and Treasure Boxes
On Elite difficulty only, here is a summary of our data about Orbs of Alchemy, Radiant Fire Crystals, and treasure boxes. The columns are:
- Name, Rank, Lv: Name, rank, and number of fighting levels.
- Data: The number of data for Orbs, Radiants, and treasure boxes. All Radiant data were collected after release 2014-02-26, when drop rates were increased. More data mean that the estimated average is more reliable. For the sake of tidiness, the table does not include confidence intervals.
- O1, O2, O3, O4, O5: Average Orbs earned per mission run, for each star level.
- FC5: Average Radiant Fire Crystals earned per mission run.
- Grn, Red: Average number of green and red treasure boxes found per run.
| Name | Rank | Lv | Data | O1 | O2 | O3 | O4 | O5 | FC5 | Grn | Red |
| Legion of Almire | Dngr | 2 | 20, 16, 12 | 0.15 | 7.5 | 12.25 | 42.67 | ||||
| Heart of Ice | Dngr | 2 | 7, 6, 1 | 0.14 | 6.0 | 11.0 | 43.0 | ||||
| Ghosts in the Machine | Dngr | 2 | 19, 16, 12 | 0.32 | 5.25 | 22.33 | 42.75 | ||||
| Compound 42 | Dngr | 2 | 19, 16, 12 | 0.42 | 6.75 | 22.75 | 42.67 | ||||
| Nature of the Beast | Prstg | 2 | 20, 20, 13 | 0.05 | 0.15 | 18.23 | 1.0 | ||||
| Pinch of Salt | Prstg | 2 | 23, 20, 13 | 0.09 | 21.46 | 1.0 | |||||
| Assault on Machine Shop 13 | Prstg | 2 | 22, 20, 13 | 0.14 | 18.69 | 0.77 | |||||
| Hazardous Heist | Prstg | 2 | 23, 21, 13 | 0.09 | 15.92 | 0.77 | |||||
| White Collar Captives | Prstg | 2 | 21, 19, 13 | 0.16 | 17.08 | 1.46 | |||||
| Scared to Death | Prstg | 2 | 22, 20, 13 | 22.08 | 0.69 | ||||||
| Operation Crimson Hammer | Expn | 5 | 5, 5, 4 | 0.2 | 2.4 | 29.25 | 16.75 | ||||
| Dreams and Nightmares | 10-2 | 3 | 12, 12, 12 | 0.08 | 21.75 | 38.33 | 21.67 | ||||
| Shadowplay | 10-2 | 3 | 11, 11, 11 | 0.09 | 4.64 | 22.45 | 12.55 | ||||
| It Came From Below | 10-1 | 3 | 11, 11, 11 | 0.09 | 21.18 | 0.27 | |||||
| Crimson Chaos | 10-1 | 3 | 13, 13, 12 | 0.08 | 2.54 | 23.83 | 0.5 | ||||
| Breaking in the Recruits | 10-1 | 3 | 12, 12, 12 | 0.08 | 0.75 | 15.25 | 0.42 | ||||
| The King of Ashes | 9-3 | 5 | 18, 13, 5 | 0.17 | 14.77 | 47.6 | 18.4 | ||||
| The Gauntlet | 9-2 | 3 | 18, 15, 11 | 0.17 | 3.0 | 31.0 | 0.82 | ||||
| Alone in the Dark | 9-2 | 3 | 20, 17, 12 | 0.2 | 0.71 | 22.92 | 0.67 | ||||
| Terminal Meltdown | 9-2 | 3 | 19, 16, 11 | 0.11 | 1.69 | 23.0 | 0.55 | ||||
| The Silent Legion | 9-1 | 3 | 18, 15, 11 | 0.17 | 1.6 | 28.91 | 1.18 | ||||
| An Occurrence at Owlite Keep | 9-1 | 3 | 19, 16, 12 | 0.26 | 1.5 | 22.75 | 0.58 | ||||
| The Great Escape | 8-2 | 3 | 17, 12, 10 | 0.12 | 26.0 | 0.8 | |||||
| The Rotting Metropolis | 8-2 | 3 | 17, 12, 10 | 25.3 | 2.7 | ||||||
| The Vile Engine | 8-2 | 3 | 17, 13, 10 | 0.06 | 21.3 | 0.6 | |||||
| Weight of Darkness | 8-1 | 3 | 17, 13, 10 | 0.06 | 0.06 | 30.5 | 1.0 | ||||
| The Return of Ur | 8-1 | 3 | 19, 15, 10 | 19.6 | 2.4 | ||||||
| Spark and Roar | 7-3 | 3 | 18, 14, 10 | 0.11 | 25.8 | 0.5 | |||||
| Beyond the Axes of Evil | 7-3 | 3 | 20, 15, 10 | 29.5 | 1.5 | ||||||
| Vicious and Viscous | 7-2 | 3 | 18, 13, 10 | 0.06 | 25.4 | 0.8 | |||||
| In Cold Blood | 7-2 | 3 | 20, 14, 10 | 0.15 | 31.5 | 0.6 | |||||
| Built to Destroy! | 6-2 | 3 | 34, 30, 10 | 0.03 | 0.26 | 0.03 | 22.7 | 8.5 | |||
| Sewer Stash | 6-2 | 3 | 16, 12, 9 | 0.44 | 29.89 | 1.11 | |||||
| Whipping and Mishandling | 6-2 | 3 | 16, 12, 9 | 0.25 | 0.06 | 31.89 | 1.78 | ||||
| High Temperature Hostages | 6-1 | 3 | 16, 12, 9 | 0.06 | 0.25 | 26.56 | 0.89 | ||||
| Plan of Attack | 6-1 | 2 | 20, 17, 9 | 0.05 | 0.2 | 0.05 | 16.22 | 0.33 | |||
| Axes of Evil | 6-1 | 2 | 17, 14, 9 | 0.06 | 0.12 | 14.67 | 0.33 | ||||
| The Sovereign Slime | 5-2 | 3 | 19, 15, 10 | 0.05 | 0.21 | 0.05 | 20.0 | 11.0 | |||
| Rise or Fall | 5-2 | 3 | 16, 12, 8 | 0.19 | 0.06 | 32.38 | 0.5 | ||||
| Time Enough at Last | 5-2 | 3 | 15, 12, 8 | 0.2 | 0.07 | 24.5 | 1.5 | ||||
| Work for Idle Hands | 5-1 | 2 | 15, 12, 8 | 0.07 | 0.07 | 17.63 | 1.25 | ||||
| Chilled to the Bone | 5-1 | 2 | 15, 12, 8 | 0.07 | 0.07 | 17.38 | 0.75 | ||||
| Shocking Sentient Sentries | 4-3 | 2 | 14, 12, 8 | 0.07 | 18.0 | 0.75 | |||||
| Rescues and Recycling | 4-3 | 2 | 14, 12, 8 | 0.07 | 0.07 | 14.75 | 1.0 | ||||
| Frostifur Fandango | 4-2 | 2 | 14, 12, 8 | 15.88 | 0.25 | ||||||
| Oilers in the Boilers | 4-2 | 2 | 14, 12, 8 | 0.07 | 0.29 | 21.25 | 0.63 | ||||
| Shadow of the Beast | 3-2 | 3 | 19, 14, 10 | 0.26 | 0.11 | 11.7 | 8.3 | ||||
| Blades of the Fallen | 3-2 | 1 | 13, 10, 7 | 0.0 | 0.0 | ||||||
| Strength in Unity | 3-2 | 2 | 13, 10, 7 | 0.15 | 13.57 | 0.71 | |||||
| Faith in Armor | 3-2 | 1 | 13, 10, 7 | 0.08 | 8.14 | 0.71 | |||||
| Toy Soldiers | 3-1 | 2 | 13, 10, 7 | 0.08 | 19.29 | 1.14 | |||||
| Alien Ooze | 3-1 | 2 | 13, 10, 7 | 0.23 | 22.29 | 0.43 | |||||
| The Collector | 2-3 | 2 | 14, 11, 7 | 12.71 | 0.14 | ||||||
| The Phantom Mask | 2-2 | 2 | 11, 10, 7 | 21.29 | 0.71 | ||||||
| Angels From Antiquity | 2-2 | 2 | 12, 10, 7 | 15.57 | 0.43 | ||||||
| A Revelation In Flames | 2-2 | 2 | 13, 10, 7 | 0.08 | 19.29 | 0.71 |
Uncertainty
The table above shows estimated rates of rarities, without showing the uncertainty in those estimates. For example, here is the number of orbs observed in each of our 16 Sewer Stash runs:
- 0, 0, 1, 1, 0, 1, 0, 2, 0, 0, 0, 0, 0, 1, 1, 0.
We might ask, "What is the average number of orbs per run?" The best estimate is 7 / 16 = 0.4375, as stated in the table above. However, the 95% confidence interval (as reported by R's poisson.test) is [0.1759, 0.9014]. So, although we expect you to get about 0.44 orbs per run, we wouldn't be surprised if you got as few as 0.18 or as many as 0.90.
A slightly different question is, "What is the proportion of runs on which we find at least one orb?" The best estimate is 6 / 16 = 0.3750. However, the 95% confidence interval (as reported by R's binom.test) is [0.1520, 0.6456].
The moral of the story is: Until we get lots more data, keep in mind that there is a lot of uncertainty in the estimates.
Orbs per Treasure Box
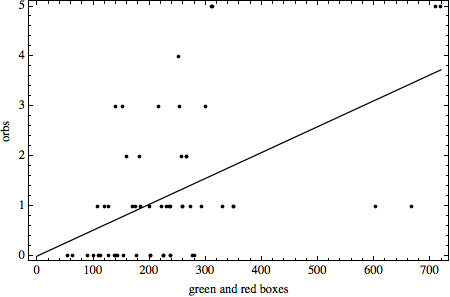
On Elite difficulty, the average number of orbs per treasure box is around 0.005. In other words, about 0.5% of boxes contain orbs.
To arrive at a similar estimate in a different way, examine the plot at right. For each mission, it shows orbs versus treasure boxes, totaled over many Elite runs. The best-fit line has slope around 0.005. As you can see, there is a lot of variation around the best-fit line. We need many more observations to pin down the orb drop rate more precisely.
This analysis does not account for the distinction between green and red boxes. There may be more orbs per red box than per green box, because green boxes contain a wider mix of pickups and other non-orb items.
Radiants over Time
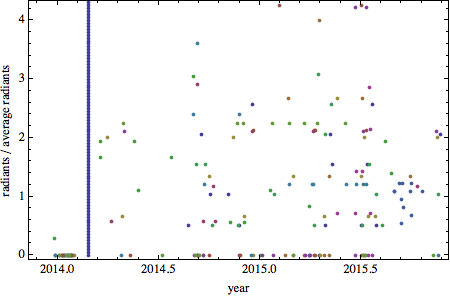
Do drop rates of Radiant Fire Crystals change over time? Our data suggest: No, except at the "Radiant buff" of release 2014-02-26.
The plot at left shows Radiants earned in many mission runs over the years. All runs are on Elite difficulty, and missions with fewer than three runs yielding Radiants are excluded. The horizontal axis is decimal years; for example, 2014.5 is the middle of 2014. The vertical axis is Radiants earned, divided by the average Radiants earned for that mission. Each dot is a single run of a mission.
If Radiant drops were deterministic and unchanging, then all of the dots would plot along the line y = 1. These dots don't, just because there is so much random variation from run to run. However, it is clear that drop rates increase dramatically across the vertical blue line, which is the Radiant buff. After that, drop rates seem not to change in any detectable way.
Radiants vs. Party Size
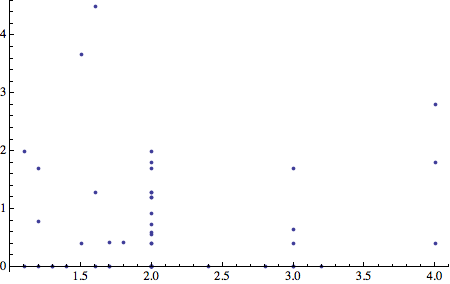
Does party size affect the number of Radiant Fire Crystals found? Our data suggest not.
In the plot at right, each dot is a single run of a mission on Elite difficulty. The horizontal axis is party size. Fractional party sizes arise from players entering and leaving the party during the run, and should be regarded as approximate only. The vertical axis is the number of Radiant Fire Crystals earned on that run, divided by the average Radiant Fire Crystals earned on all solo runs of that mission.
For a mission to be counted, it must meet some minimum requirements. We must have at least three solo runs recorded, in which Radiant Fire Crystals were measured. Also, we must have found at least one Radiant Fire Crystal during those solo runs. In the end, the plot reflects 208 solo runs and 51 non-solo runs of 18 distinct missions.
If there were no effect of party size on Radiant Fire Crystals found, then the data would cluster along the line y = 1. On the other hand, if Radiant Fire Crystals increased linearly with party size, for example, then the data would cluster along a line with positive slope.
The plot shows that there is a lot of variability in Radiant Fire Crystals from run to run. So we would like to have more data, to mitigate that variability. However, based on the data we have, we see no relationship between party size and Radiant Fire Crystals.


