Uploads by Vroom
From SpiralKnights
This special page shows all uploaded files.
| Date | Name | Thumbnail | Size | Description | Versions |
|---|---|---|---|---|---|
| 20:18, 28 September 2016 | Donkeyhautee.png (file) |  |
163 KB | 1 | |
| 20:11, 28 September 2016 | Donkeyhauted.png (file) |  |
82 KB | 2 | |
| 20:10, 28 September 2016 | Donkeyhautec.png (file) |  |
77 KB | 2 | |
| 20:10, 28 September 2016 | Donkeyhauteb.png (file) |  |
87 KB | 2 | |
| 20:09, 28 September 2016 | Donkeyhautea.png (file) |  |
81 KB | 2 | |
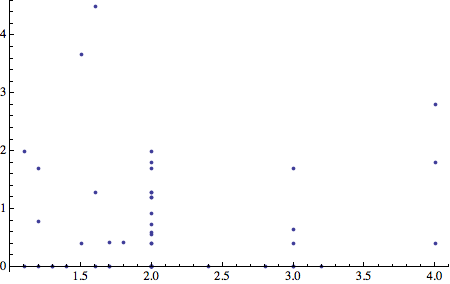
| 20:43, 27 February 2016 | RadiantsPartySize.png (file) |  |
5 KB | Each dot is a mission run on Elite difficulty. The horizontal axis is party size; fractional party sizes arise from players entering and leaving. The vertical axis is the number of Radiant Fire Crystals earned on that run, divided by the average Radiant Fire Crystals earned on all solo runs of that mission. Only missions with at least three solo runs and at least one Radiant Fire Crystal found during those solo runs are counted. | 1 |
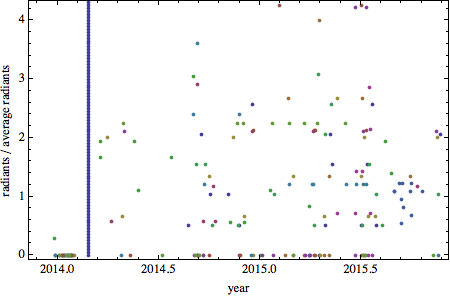
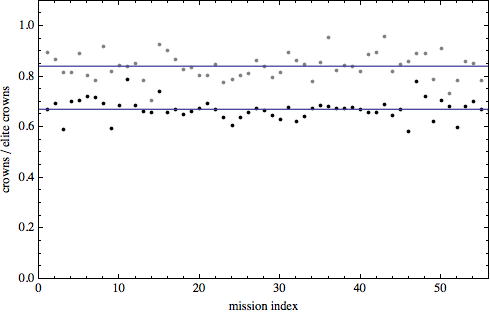
| 20:00, 30 November 2015 | RadiantsTime.png (file) |  |
14 KB | More data. Better labels. Now showing data relative to average for each mission, rather than as absolutes. Removed join lines. | 2 |
| 19:59, 30 November 2015 | OrbsBoxes.png (file) |  |
12 KB | More data. Better labels. | 2 |
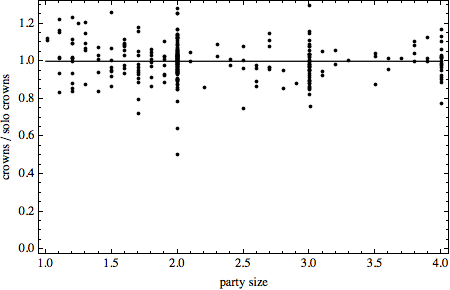
| 19:58, 30 November 2015 | Partysize.png (file) |  |
12 KB | More data. Better labels. | 5 |
| 19:57, 30 November 2015 | Difficulty.png (file) |  |
11 KB | More data. Better labels. | 5 |
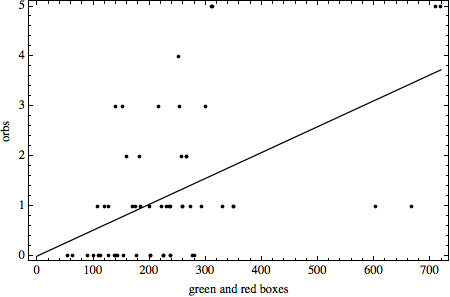
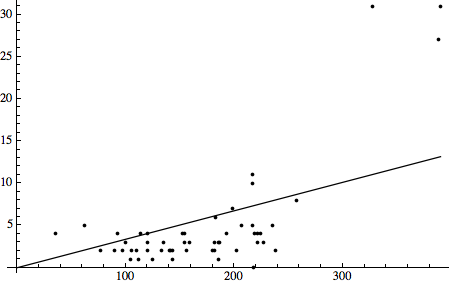
| 17:13, 16 June 2015 | SparksBoxes.png (file) |  |
8 KB | Data from the Lancer Knightz (Guild) data project. Horizontal axis is number of green and red boxes. Vertical axis is number of Forge, Grim, and Primal Sparks found in those boxes. The superimposed best-fit line, which isn't a great fit really, has slope 0.034, suggesting that about 3.4% of boxes contain sparks. | 1 |
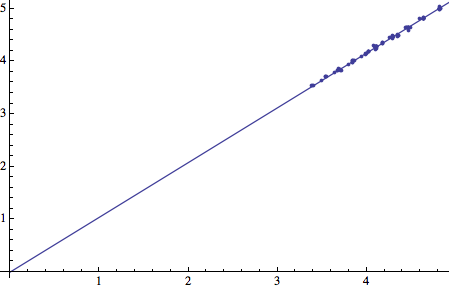
| 21:35, 12 May 2014 | Msitestplot.png (file) |  |
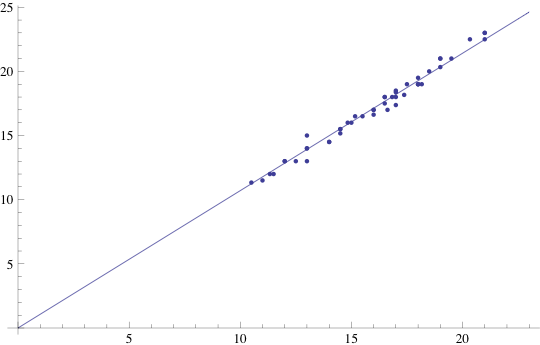
9 KB | Plot of running speed, in tiles per second, when charging a sword at MSI+N vs. MSI+(N+1). The superimposed best-fit line has slope 1.04011. Thus each level of MSI increases speed by about 4%. | 1 |
| 17:46, 12 May 2014 | Msitestend.png (file) |  |
965 KB | End of Lancer Knightz MSI test run. | 1 |
| 17:45, 12 May 2014 | Msiteststart.png (file) |  |
987 KB | 1 | |
| 01:49, 25 March 2014 | Expansion-Hunter's Lodge.png (file) |  |
547 KB | Actual screenshot (not icon) of Hunter's Lodge. | 2 |
| 01:48, 25 March 2014 | Expansion-Hunter's Lodge icon.png (file) | 6 KB | File was erroneously (?) placed at Expansion-Hunter's_Lodge.png. | 1 | |
| 15:06, 21 November 2013 | Swordcombos.png (file) |  |
10 KB | Sword combos per minute (CPM) data collected by Lancer Knightz. Each sword's data plot as a sequence of points. Each point consists of the CPM at one level of ASI, paired with the CPM at the next level of ASI. The best fit line of the form y = m x has slope m = 1.03563, suggesting that each level of ASI increases CPM by about 3.6%. | 1 |
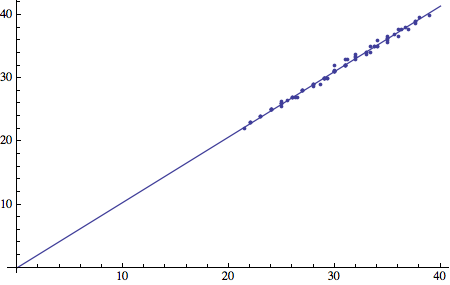
| 16:41, 10 November 2013 | Swordcharges.png (file) |  |
14 KB | Plot of sword charges-per-minute (CPM) data, made by Lancer Knightz (Guild). Each sword is measured repeatedly at each level of CTR available (and always at ASI+6). In each sword+CTR combination, the average is computed. Then, each CPM count is plotted against the next CPM count. For example, CTR+2 is plotted against CTR+3, and CTR+3 is plotted against CTR+4, etc. The best-fit line of the form y = m x + b has slope 1.07054, suggesting that each level of CTR increases CPM by about 7%. | 1 |
| 14:46, 27 April 2013 | Gametime.png (file) |  |
35 KB | Illustration of how to check game time (San Francisco local time). | 1 |
| 16:06, 9 March 2013 | Bombdamagebonus19.png (file) |  |
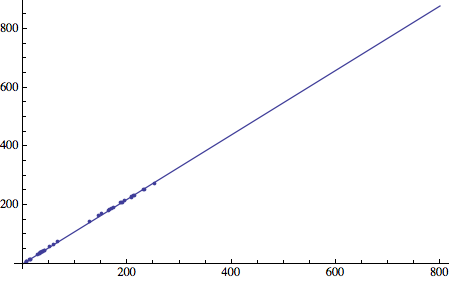
10 KB | Bomb damage data from depth 19. Plot of +0, +2, +4 damage bonus numbers against their corresponding +2, +4, +6 damage bonus numbers. The best-fit line of the form Y = M X has slope M = 1.09784, suggesting that two levels of damage bonus give a 9.784% increase in damage. | 1 |
| 16:05, 9 March 2013 | Bombdamagebonus24.png (file) |  |
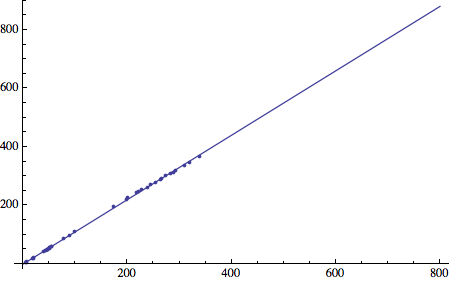
10 KB | Bomb damage data from depth 24. Plot of +0, +2, +4 damage bonus numbers against their corresponding +2, +4, +6 damage bonus numbers. The best-fit line of the form Y = M X has slope M = 1.10029, suggesting that two levels of damage bonus give a 10.029% increase in damage. | 1 |
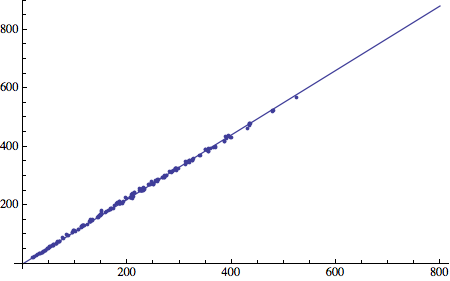
| 16:04, 9 March 2013 | Handgundamagebonus19.png (file) |  |
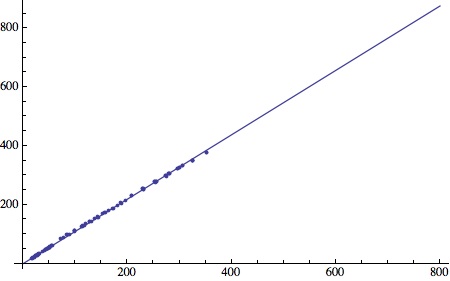
10 KB | Handgun damage data from depth 19. Plot of +0, +2, +4 damage bonus numbers against their corresponding +2, +4, +6 damage bonus numbers. The best-fit line of the form Y = M X has slope M = 1.09455, suggesting that two levels of damage bonus give a 9.455% increase in damage. | 1 |
| 16:04, 9 March 2013 | Handgundamagebonus24.png (file) |  |
11 KB | Handgun damage data from depth 24. Plot of +0, +2, +4 damage bonus numbers against their corresponding +2, +4, +6 damage bonus numbers. The best-fit line of the form Y = M X has slope M = 1.09538, suggesting that two levels of damage bonus give a 9.538% increase in damage. | 1 |
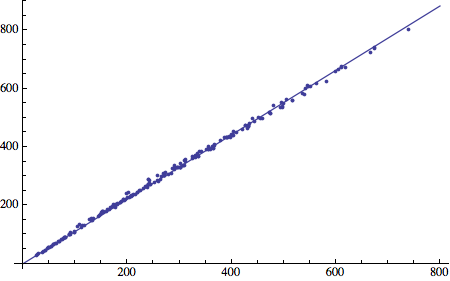
| 14:11, 9 March 2013 | Sworddamagebonus24.png (file) |  |
11 KB | Sword damage data from depth 24. Plot of +0, +2, +4 damage bonus numbers against their corresponding +2, +4, +6 damage bonus numbers. The best-fit line of the form Y = M X has slope M = 1.10455, suggesting that two levels of damage bonus give a 10.455% increase in damage. | 1 |
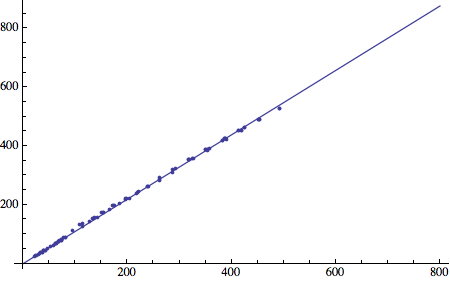
| 14:10, 9 March 2013 | Sworddamagebonus19.png (file) |  |
11 KB | Sword damage data from depth 19. Plot of +0, +2, +4 damage bonus numbers against their corresponding +2, +4, +6 damage bonus numbers. The best-fit line of the form Y = M X has slope M = 1.10198, suggesting that two levels of damage bonus give a 10.198% increase in damage. | 1 |
| 16:32, 19 September 2012 | Donkeyhautesquamph.png (file) |  |
163 KB | Donkeyhaute and Squamph in nearly-matching Surge costumes. | 1 |