Difference between revisions of "File:Swordcharges.png"
From SpiralKnights
(Plot of sword charges-per-minute (CPM) data, made by Lancer Knightz (Guild). Each sword is measured repeatedly at each level of CTR available (and always at ASI+6). In each sword+CTR combination, the average is computed. Then, each CPM count is plotted against the next CPM count. For example, CTR+2 is plotted against CTR+3, and CTR+3 is plotted against CTR+4, etc. The best-fit line of the form y = m x + b has slope 1.07054, suggesting that each level of CTR increases CPM by about 7%.) |
m |
||
| Line 1: | Line 1: | ||
Plot of sword charges-per-minute (CPM) data, made by Lancer Knightz (Guild). Each sword is measured repeatedly at each level of CTR available (and always at ASI+6). In each sword+CTR combination, the average is computed. Then, each CPM count is plotted against the next CPM count. For example, CTR+2 is plotted against CTR+3, and CTR+3 is plotted against CTR+4, etc. The best-fit line of the form y = m x + b has slope 1.07054, suggesting that each level of CTR increases CPM by about 7%. | Plot of sword charges-per-minute (CPM) data, made by Lancer Knightz (Guild). Each sword is measured repeatedly at each level of CTR available (and always at ASI+6). In each sword+CTR combination, the average is computed. Then, each CPM count is plotted against the next CPM count. For example, CTR+2 is plotted against CTR+3, and CTR+3 is plotted against CTR+4, etc. The best-fit line of the form y = m x + b has slope 1.07054, suggesting that each level of CTR increases CPM by about 7%. | ||
| + | {{guild image}} | ||
Latest revision as of 22:35, 30 September 2015
Plot of sword charges-per-minute (CPM) data, made by Lancer Knightz (Guild). Each sword is measured repeatedly at each level of CTR available (and always at ASI+6). In each sword+CTR combination, the average is computed. Then, each CPM count is plotted against the next CPM count. For example, CTR+2 is plotted against CTR+3, and CTR+3 is plotted against CTR+4, etc. The best-fit line of the form y = m x + b has slope 1.07054, suggesting that each level of CTR increases CPM by about 7%.
| |
|
File history
Click on a date/time to view the file as it appeared at that time.
| Date/Time | Thumbnail | Dimensions | User | Comment | |
|---|---|---|---|---|---|
| current | 16:41, 10 November 2013 | 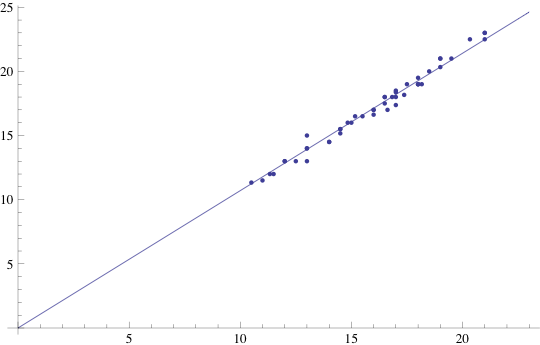 | 540 × 345 (14 KB) | Vroom (Talk | contribs) | Plot of sword charges-per-minute (CPM) data, made by Lancer Knightz (Guild). Each sword is measured repeatedly at each level of CTR available (and always at ASI+6). In each sword+CTR combination, the average is computed. Then, each CPM count is plotted against the next CPM count. For example, CTR+2 is plotted against CTR+3, and CTR+3 is plotted against CTR+4, etc. The best-fit line of the form y = m x + b has slope 1.07054, suggesting that each level of CTR increases CPM by about 7%. |
- You cannot overwrite this file.
File usage
The following page links to this file: