Difference between revisions of "File:Difficulty.png"
From SpiralKnights
(uploaded a new version of "File:Difficulty.png": Comparison of crown payouts at various difficulty levels, incorporating new data. Advanced payouts are now about 84% of Elite payouts. Normal payouts are now about 67% of Elite payouts.) |
m |
||
| Line 1: | Line 1: | ||
Plot showing data about the effect of difficulty on mission crown payouts. Each dot represents a mission on Elite (purple) or Normal (blue) difficulty. The x-axis is the average Advanced payout for the mission; the y-axis is Elite and Normal payouts. Best-fit lines are superimposed. The data suggest that Elite payouts are about 121% of Advanced payouts and Normal payouts are about 81% of Advanced payouts. | Plot showing data about the effect of difficulty on mission crown payouts. Each dot represents a mission on Elite (purple) or Normal (blue) difficulty. The x-axis is the average Advanced payout for the mission; the y-axis is Elite and Normal payouts. Best-fit lines are superimposed. The data suggest that Elite payouts are about 121% of Advanced payouts and Normal payouts are about 81% of Advanced payouts. | ||
| + | |||
| + | {{guild image}} | ||
Revision as of 16:35, 30 September 2015
Plot showing data about the effect of difficulty on mission crown payouts. Each dot represents a mission on Elite (purple) or Normal (blue) difficulty. The x-axis is the average Advanced payout for the mission; the y-axis is Elite and Normal payouts. Best-fit lines are superimposed. The data suggest that Elite payouts are about 121% of Advanced payouts and Normal payouts are about 81% of Advanced payouts.
| |
|
File history
Click on a date/time to view the file as it appeared at that time.
| Date/Time | Thumbnail | Dimensions | User | Comment | |
|---|---|---|---|---|---|
| current | 19:57, 30 November 2015 | 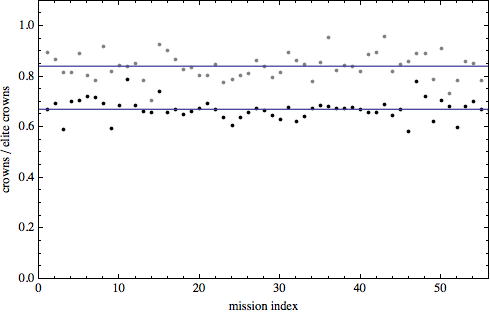 | 490 × 315 (11 KB) | Vroom (Talk | contribs) | More data. Better labels. |
| 17:01, 21 May 2015 | 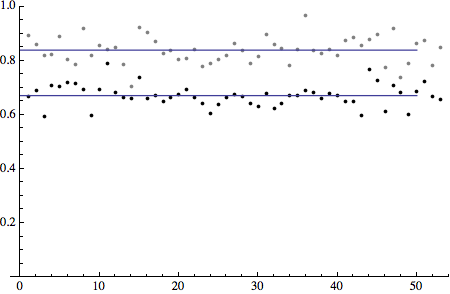 | 450 × 294 (7 KB) | Vroom (Talk | contribs) | Comparison of crown payouts at various difficulty levels, incorporating new data. Advanced payouts are now about 84% of Elite payouts. Normal payouts are now about 67% of Elite payouts. | |
| 15:59, 14 November 2014 | 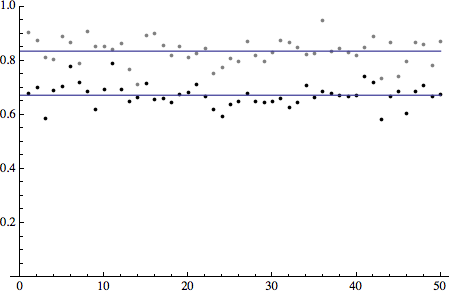 | 450 × 294 (7 KB) | Vroom (Talk | contribs) | Many, many more data, and plot style changed. Now shows normal average / elite average (black) and advanced average / elite average (gray). | |
| 16:43, 30 January 2014 | 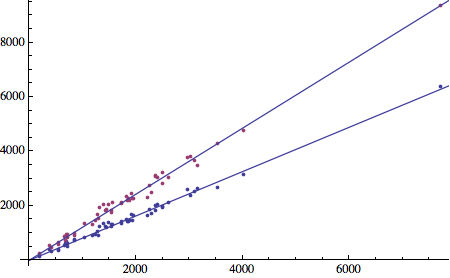 | 450 × 278 (16 KB) | Vroom (Talk | contribs) | ||
| 13:20, 2 January 2014 | 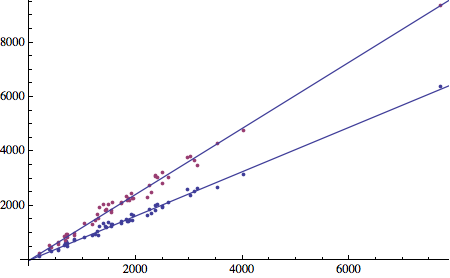 | 450 × 278 (16 KB) | Vroom (Talk | contribs) | Plot showing data about the effect of difficulty on mission crown payouts. Each dot represents a mission on Elite (purple) or Normal (blue) difficulty. The x-axis is the average Advanced payout for the mission; the y-axis is Elite and Normal payouts. Best-fit lines are superimposed. The data suggest that Elite payouts are about 121% of Advanced payouts and Normal payouts are about 81% of Advanced payouts. |
- You cannot overwrite this file.
File usage
The following page links to this file: